
Marketing Agency Automated Client Reporting Examples
Marketing agency automated client reporting examples work best when each report answers one client question, uses a defined source of truth, and flags exceptions.
TL;DR
- Start with one recurring client question, then choose the metrics and source systems that answer it.
- Keep advertising, CRM, and website data definitions separate until an explicit reporting rule combines them.
- Use scheduled delivery as transport, not as proof that the underlying report is accurate.
- Add a reporting-health layer that blocks or flags incomplete data before clients receive it.
Still rebuilding client reports by hand?
HWA can map the data sources, reporting definitions, delivery cadence, and exception rules before automating the workflow.
Automated client reporting should answer decisions, not just display data
Marketing agency automated client reporting examples are useful only when they reduce uncertainty for the client and the account team.
A report should make it easier to answer a recurring question such as where leads came from, whether paid media is producing qualified demand, where opportunities are stalling, or which accounts need attention.
A dashboard full of disconnected metrics can be technically automated and still create more work because someone has to explain what matters every time it arrives.
The cleanest reporting systems start with a defined source of truth for each metric. Advertising platforms should own platform spend and campaign delivery. The CRM should own lifecycle stage, opportunity state, and sales activity when those records are maintained there. Web analytics should own website behavior. The reporting layer can combine those sources, but it should not silently redefine them.
Google documents that Looker Studio can connect to Google Analytics data sources, while Google Ads and HubSpot both provide ways to create and schedule recurring reports. That makes automated delivery possible, but the agency still has to decide what the report means.
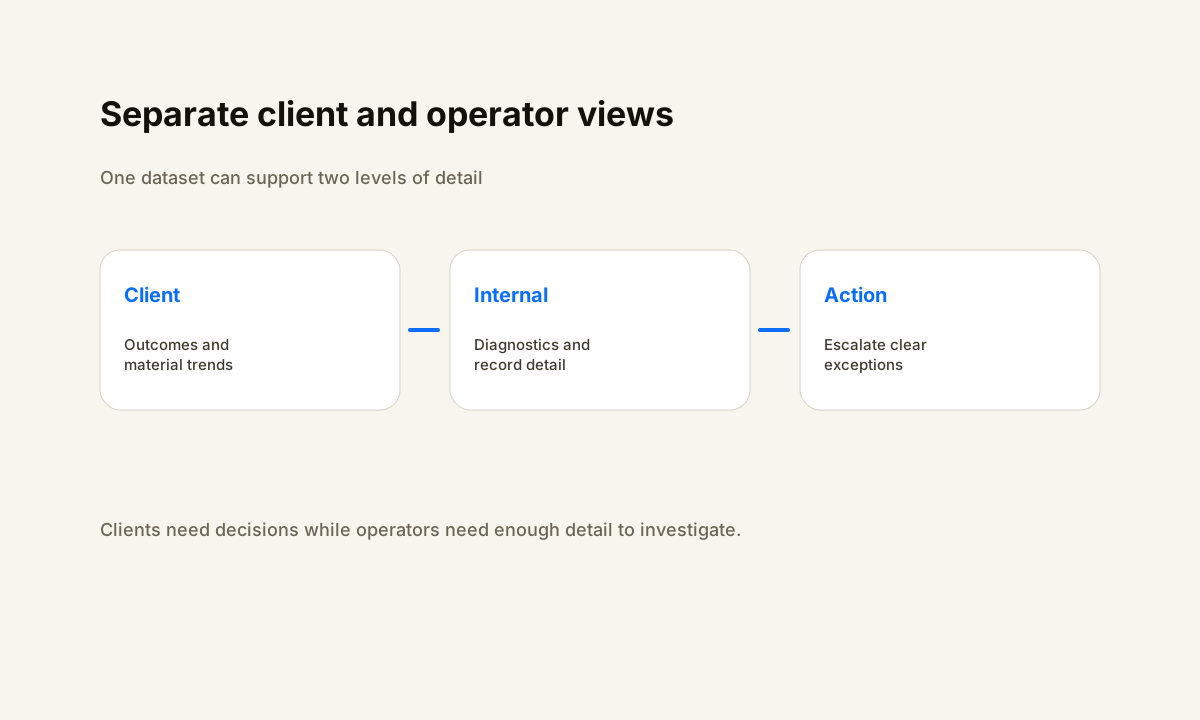
A useful design also separates a client-facing scorecard from an internal operating report. Clients usually need a smaller set of outcomes and trends. The agency team needs more diagnostic detail, including missing data, broken tracking, stale pipeline stages, or campaigns with no recent conversion activity.
When those two audiences are forced into one dashboard, the result tends to become noisy for the client and too shallow for the operator.
Example 1: weekly lead source and qualification scorecard
The first example is a weekly scorecard that connects acquisition channels to lead quality. The report can show leads by source, qualified leads by source, booked meetings, and current opportunity status. The important design choice is that qualification and opportunity state come from the CRM, not from the ad platform.
An ad platform can report a conversion event, but it cannot reliably tell the agency whether the sales team considered that lead qualified unless that business state is written back and governed.
This report is especially useful when a client asks which channel is actually producing the right leads. A simple table can list each source, total leads, qualified leads, booked meetings, and a note for material tracking gaps.
The report should not invent a conversion rate when the CRM is missing required stages. Instead, the automation should flag the denominator or numerator as incomplete and route the exception for repair.
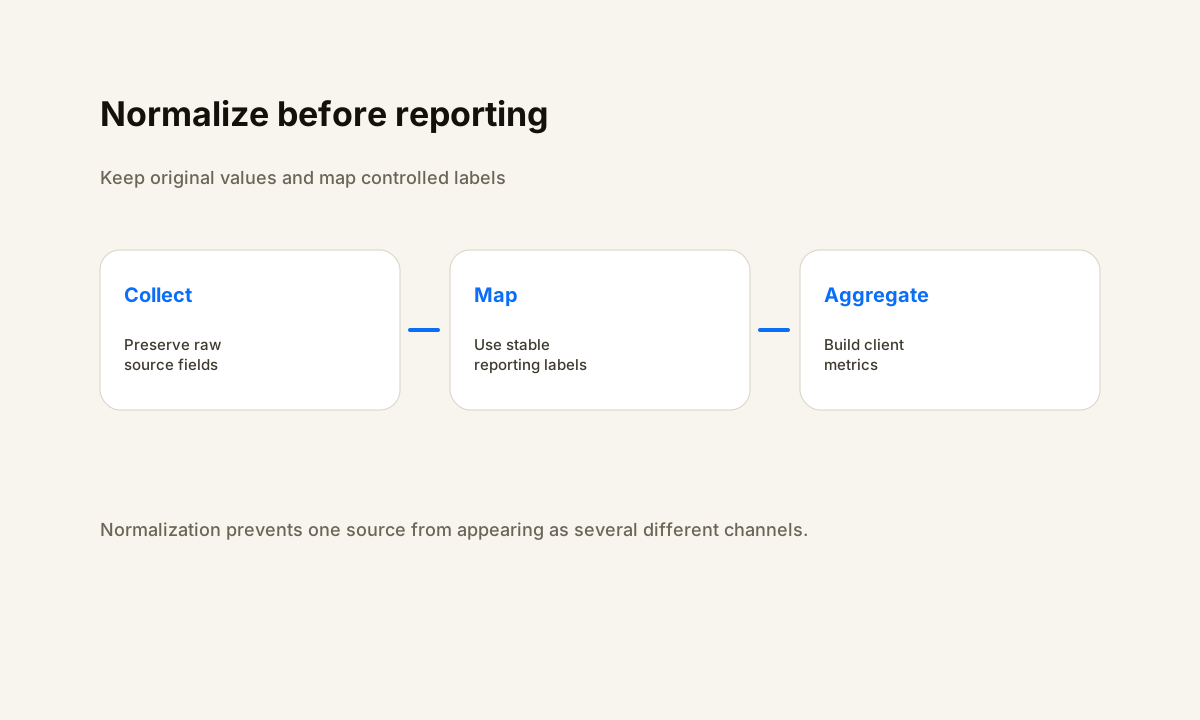
For implementation, keep channel naming normalized before aggregation. Google Ads, google, and Paid Search should not become three separate rows if they represent the same source. Preserve the original platform fields for auditability, then map them to a controlled reporting label. This is where a reporting workflow becomes an operations system rather than a prettier spreadsheet.
Example 2: paid media spend to pipeline report
A second client reporting pattern connects paid media spend to CRM pipeline state. Google Ads supports customizable reports and scheduled report delivery, which can supply recurring campaign data to the reporting process. The agency can combine that spend data with verified CRM outcomes to show cost context next to opportunities, booked meetings, or other agreed business stages.
The safest version does not claim perfect attribution. It labels what is directly observed and distinguishes that from modeled or influenced revenue. For example, a client-facing table might show platform spend, tracked leads, qualified leads, and CRM opportunities associated with the same reporting period.
If the business uses multiple attribution models, the report should name the model instead of presenting one number as unquestionable truth.
This report becomes valuable when it creates an exception list. A campaign with spend but no tracked leads may indicate weak performance, broken tracking, or simply a lag between click and recorded outcome. The automation should not decide which explanation is true without evidence.
It should surface the mismatch, include the underlying identifiers and date range, and give the account team a clear place to investigate.
Example 3: pipeline movement and follow-up coverage report
The third example is an internal-to-client bridge report focused on pipeline movement. It answers whether new opportunities are advancing and whether follow-up is actually happening. Useful fields include new opportunities created, stage changes, opportunities with no recent activity, next-step dates, and records missing an owner.
HubSpot documents recurring report and dashboard email delivery, so teams using HubSpot can distribute a governed report on a daily, weekly, or monthly cadence.
The client-facing version should stay compact. It can summarize how many opportunities entered key stages and list only material exceptions that require attention. The internal version can show the individual records behind those counts. This split prevents a weekly executive report from turning into a long task list while preserving enough detail for the agency to act.
Ownership matters here. A reporting workflow should never move a deal or invent a next step just because a field is blank. Reporting is observation unless a separate, authorized workflow owns the mutation. Keeping those responsibilities separate makes the audit trail clearer and prevents a dashboard refresh from becoming an accidental business action.
Example 4: website demand and campaign landing page report
A fourth pattern combines website behavior with campaign context. Looker Studio supports a Google Analytics connector, and its broader data source model can connect reporting to multiple underlying systems. An agency can use that reporting layer to show sessions, landing page engagement, form events, and other agreed website signals next to campaign or source context.
The important limitation is that website behavior is not the same thing as revenue. A landing page can attract traffic without creating qualified opportunities. The report should therefore keep web metrics in their proper role: evidence about demand and behavior.
When the agency needs to connect those signals to pipeline outcomes, the join should be based on a documented identifier or attribution rule rather than a visual assumption.
This is also a good place to use a client-specific filter or view. A standardized dashboard template can preserve the same layout across accounts while each client receives only its own data. Looker Studio provides scheduled PDF delivery and sharing options, but the agency still needs to validate permissions, date ranges, filters, and data freshness before treating delivery as complete.
Example 5: reporting health and data-quality exceptions
The fifth example is the report many agencies skip: a reporting health scorecard. Instead of showing marketing performance, it shows whether the reporting system itself is trustworthy. Useful checks include missing UTM values, unmapped lead sources, duplicate records, opportunities without owners, disconnected data sources, stale refresh timestamps, and scheduled deliveries that failed.
This report is usually internal, but it protects every client-facing report. If the CRM stopped receiving a source field on Tuesday, the team should know before Friday's scorecard is sent. If a dashboard data source lost authorization, the system should flag the condition rather than quietly deliver an incomplete PDF.
The best automation is not the one that sends reports most aggressively. It is the one that knows when it lacks enough evidence to send a confident report.
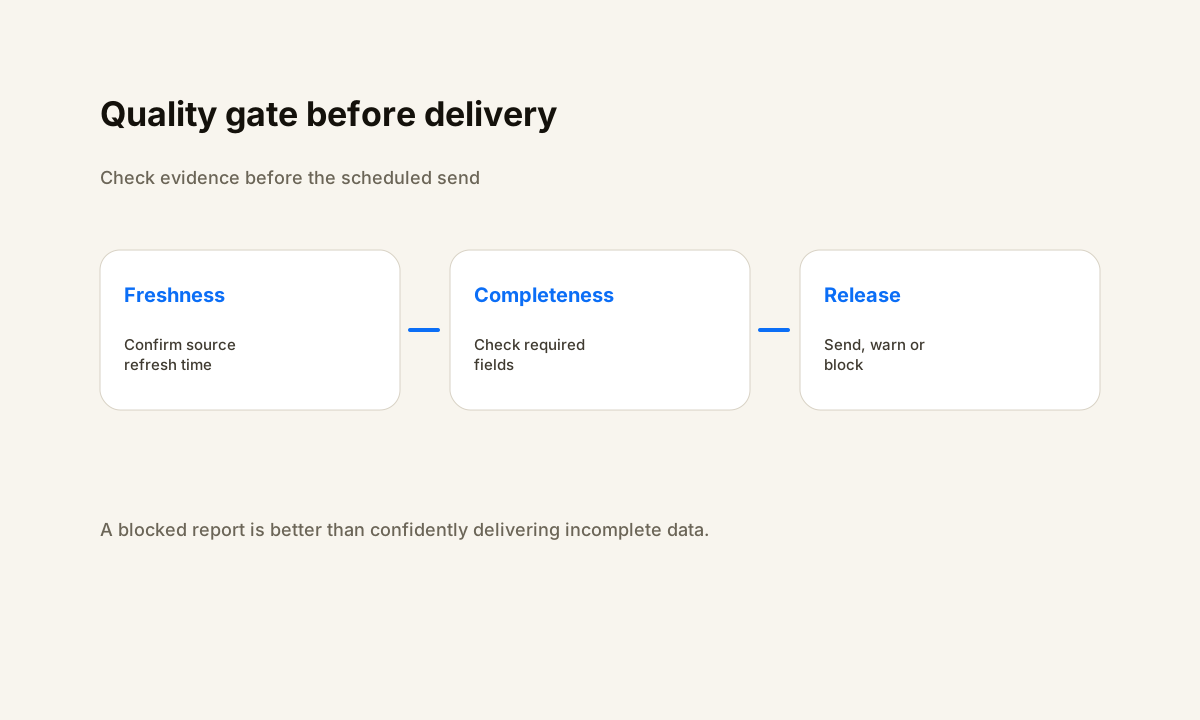
Build the health checks as explicit pass, warning, and blocked conditions. A warning can allow delivery with a visible note when the missing data is noncritical. A blocked condition should stop delivery when the report would materially mislead the recipient. This turns quality control into a repeatable rule instead of a last-minute manual review.
A practical architecture for automated agency reporting
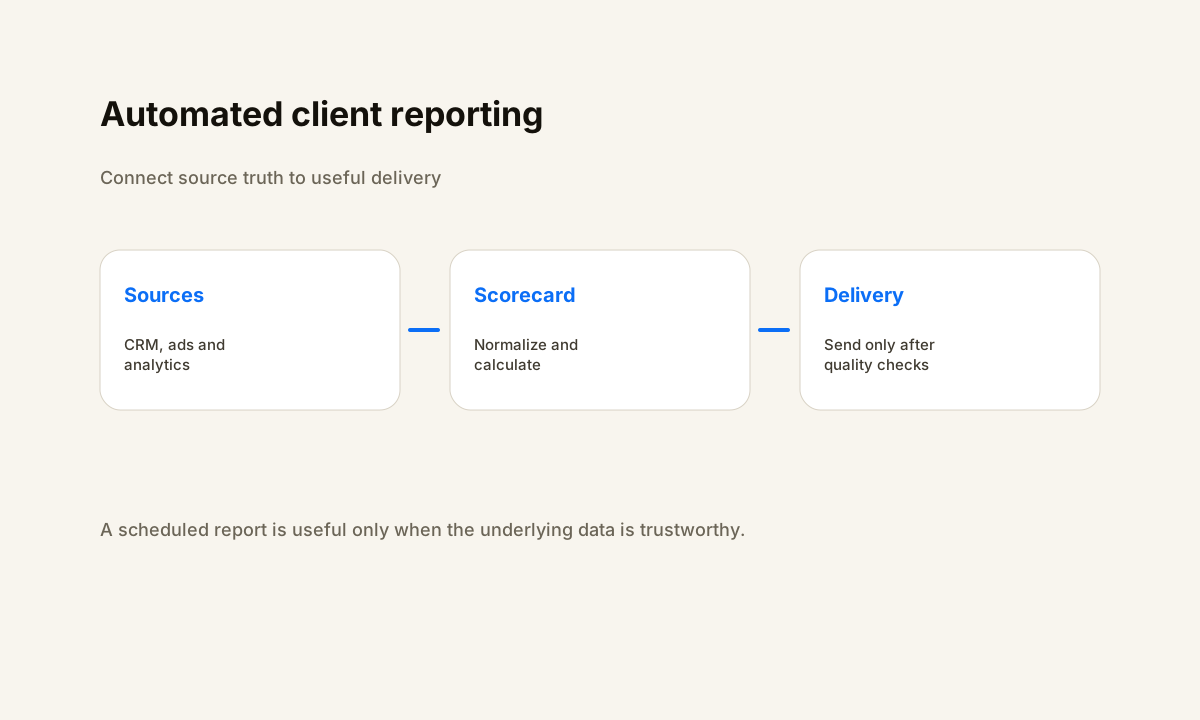
A reliable reporting workflow usually has five layers: source systems, normalization, reporting logic, delivery, and exception handling. Source systems remain authoritative for the facts they own. A normalization step maps fields and identifiers into a stable reporting model. The reporting layer calculates only documented metrics.
Delivery sends or shares the approved output. Exception handling catches missing data, failed refreshes, permission problems, and unusual discrepancies.
Do not make the delivery mechanism the source of truth. Scheduled email is useful because it puts the report where people already work, but a sent email does not prove the underlying data was correct. HubSpot, Google Ads, and Looker Studio all document scheduled reporting or delivery capabilities.
Use those features as transport while preserving independent checks for data freshness and completeness.
For agencies with several clients, the next design question is whether to use one reusable template or separate dashboards. Templates reduce maintenance when clients share a common operating model. Separate dashboards are safer when definitions, permissions, or source systems differ materially. The right choice is the one that keeps client boundaries obvious and makes changes testable.
If your current reporting process depends on copying numbers into slides or spreadsheets every week, start by automating one stable report with one clear owner. The HWA services page outlines the broader automation work HWA handles, and the workflow audit is the place to map the sources, definitions, and failure conditions before rebuilding a reporting process.
Choose the first report by business question
The best first automation is not necessarily the report with the most data. Choose the report that answers a recurring client question and has reasonably clean source systems behind it. If clients keep asking which channels create qualified leads, start with lead source and qualification.
If the recurring concern is advertising efficiency, start with spend to pipeline. If account managers spend hours explaining stale opportunities, start with pipeline movement and follow-up coverage.
Define the question, source of truth, refresh cadence, recipient, and failure conditions before choosing the visualization tool. Then test the report against a small set of known records. Compare the automated result with the underlying systems, intentionally create a safe missing-data case, and confirm the workflow flags it. Only after those checks should recurring delivery be treated as production-ready.
HWA's case studies show the kind of operational evidence we look for before calling an automation complete. You can also review Looker Studio vs Metabase for small business reporting if the next decision is which reporting layer fits your stack.
Sources
These primary product documents support the reporting and delivery capabilities referenced in this guide. Product capabilities can change, so verify the current documentation before implementation.
Frequently Asked Questions
What should an automated client report include?
Include only metrics tied to a recurring client question, name the source of truth for each metric, show the reporting period, and surface material data-quality gaps. Keep diagnostic detail in an internal view when clients do not need it.
How often should a marketing agency send automated reports?
Use the cadence that matches the decision. Weekly reporting often fits active campaign and pipeline reviews, while monthly reporting can fit broader trend analysis. The cadence should never be faster than the underlying data can be verified.
Can Looker Studio automate client reporting?
Looker Studio can connect to sources such as Google Analytics and supports scheduled report delivery. Agencies still need to govern source definitions, permissions, filters, freshness, and exception handling before treating scheduled delivery as complete.
Can HubSpot send recurring reports automatically?
HubSpot documents recurring report and dashboard email delivery on daily, weekly, or monthly schedules, subject to the report type, recipient, subscription, and permission rules described in its documentation.
How do agencies prevent automated reports from sending bad data?
Add explicit quality gates before delivery. Check required sources, refresh timestamps, date ranges, identifiers, unmapped values, and material discrepancies. Block or clearly annotate delivery when the report would otherwise be misleading.
Build the report around the business decision
Map the sources, definitions, quality checks, and delivery rules before adding another dashboard to the stack.