
Reporting Automation Tools for Small Businesses
Reporting automation tools for small businesses differ most in data refresh, permissions, distribution, and the technical ownership they require.
TL;DR
- Compare reporting tools by source connections, refresh behavior, permissions, scheduled delivery, and failure ownership.
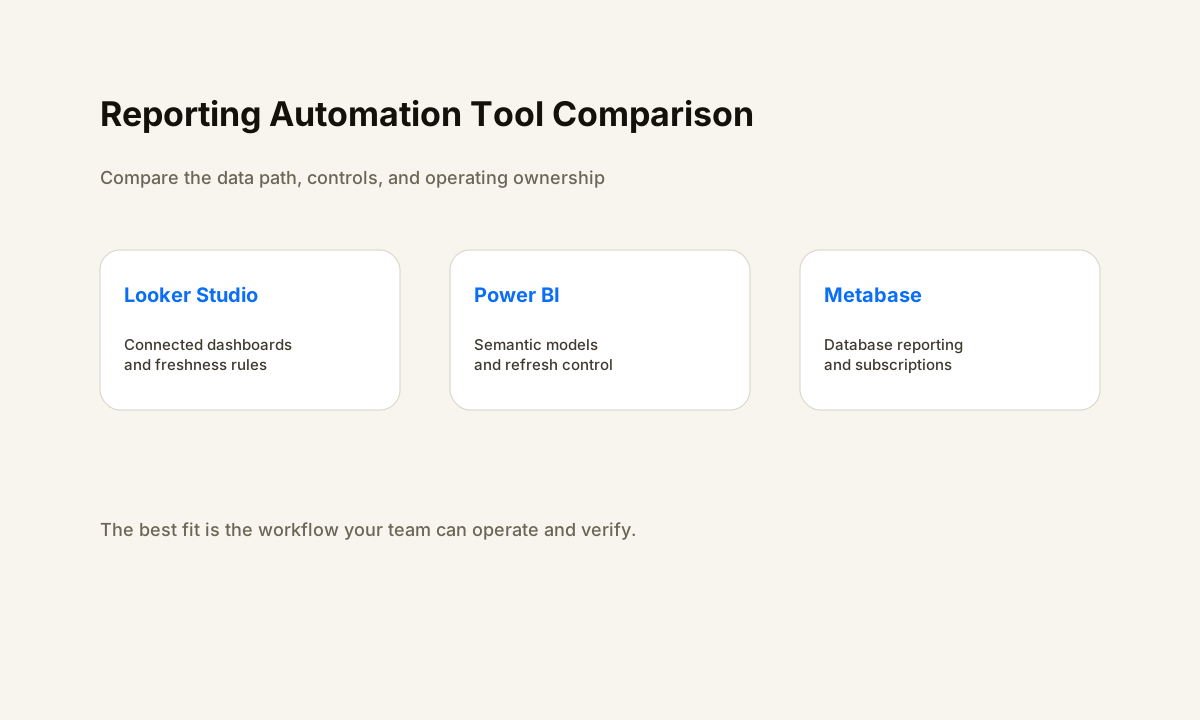
- Looker Studio can fit Google-centered reporting when a team wants flexible connected dashboards with explicit freshness settings.
- Power BI can fit teams that need a managed semantic model, scheduled refresh controls, and Microsoft-centered analytics operations.
- Metabase can fit teams that want reporting close to operational databases with collection permissions and scheduled dashboard subscriptions.
Need reporting that does not depend on a weekly spreadsheet scramble?
HWA can map the source data, refresh rules, dashboard ownership, delivery cadence, and exception path before the reporting workflow is automated.
How to Compare Reporting Automation Tools for Small Businesses
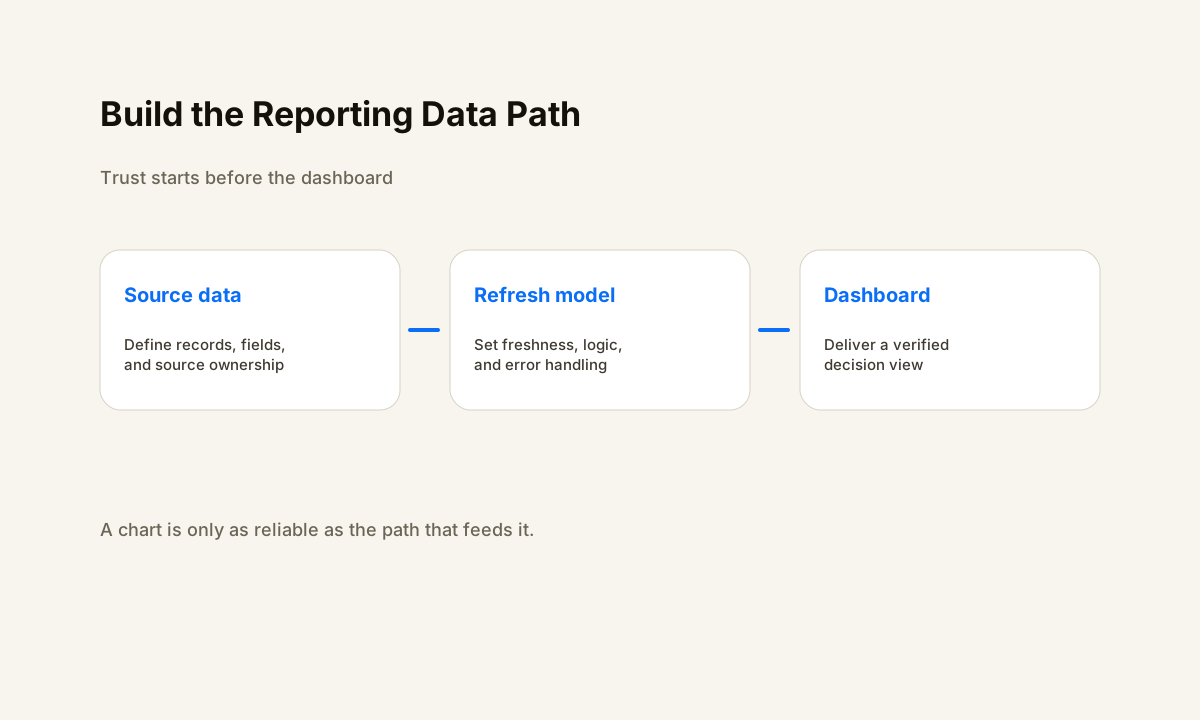
A useful comparison starts before the dashboard. Reporting automation is a chain from source data to a decision.
The chain usually includes a system of record, a connector or query, a refresh rule, a calculation layer, a dashboard or report, a permission model, a delivery method, and a person who owns exceptions. If one of those links is undefined, a polished dashboard can still be operationally weak.
Start by naming the decisions the report supports. A sales owner may need pipeline movement, first-response timing, bookings, and lost reasons. An operations owner may need workload, unresolved exceptions, completion states, and service capacity. A finance owner may need invoicing, collections, cash movement, and reconciled revenue.
Each decision needs a known source and a freshness requirement that matches how quickly the underlying process changes.
Then compare tools across the same criteria: supported data sources, refresh behavior, transformation or semantic-model control, row-level or collection-level access, scheduled distribution, alerting, credential ownership, change management, and failure visibility. That keeps the evaluation focused on operating reliability instead of chart styles.
Small businesses also need to consider who will maintain the system. A tool that is flexible but requires technical ownership can be a poor fit when no one is responsible for queries, permissions, credentials, and connector failures. The best reporting stack is one the business can explain and verify.
Looker Studio: Connected Dashboards With Explicit Freshness Rules
Looker Studio is a natural option when reporting is already close to Google-connected data or when a team wants to assemble dashboards from supported connectors without building a separate application. Google documents data sources as the connection layer between a report and the underlying data. The source also controls fields, credentials, and how viewers can access the connected information.
Data freshness deserves special attention. Google documents freshness settings for many data-source types and explains that the selected freshness threshold affects when Looker Studio can query for updated data. That makes the refresh decision visible instead of leaving a team to assume every chart is current.
A business should still define its own freshness target for each important metric and verify that the connector can meet it.
Looker Studio can be a strong fit when the reporting workflow is relatively direct: a trusted source, a controlled connector, a shared dashboard, and a clear owner for data-source credentials. It becomes harder to govern when teams create many disconnected data sources, duplicate calculated fields, or let ownership depend on one employee account without documentation.
For a small business, the key question is not whether Looker Studio can make the chart. It is whether the team can name the source, credential owner, freshness rule, calculation owner, and response when a connector stops returning expected data.
Power BI: Semantic Models and Scheduled Refresh Control
Power BI is worth considering when the business already operates inside a Microsoft-centered data environment or needs more explicit control around semantic models and scheduled refresh. Microsoft documents scheduled refresh at the semantic-model level and shows that credentials, gateways, data-source configuration, and capacity can affect whether the refresh succeeds.
That operating model can be useful when multiple reports should depend on the same governed definitions. Instead of rebuilding the meaning of revenue, active customer, qualified lead, or service completion inside each chart, a team can centralize more of the reporting logic in the model. The tradeoff is that someone has to own that model and understand the refresh dependencies.
Microsoft also documents that scheduled refresh behavior depends on the license and capacity in use, and that refresh timing can be affected by service conditions. Rather than designing around a memorized platform limit, define the decision cadence first, then verify that the current Power BI plan and gateway design support it.
Power BI is often a better operational fit when the reporting system is expected to become a shared analytics layer rather than a collection of individual dashboards. For a smaller team, that benefit is real only when the company is prepared to maintain the data model, permissions, credentials, and gateway path.
Metabase: Operational Questions, Permissions, and Subscriptions
Metabase takes a different path that can fit teams working directly with operational databases. It lets teams build questions and dashboards around connected data, then organize access through data and collection permissions. That can make it useful when the reporting layer sits close to the database that already contains the operational truth.
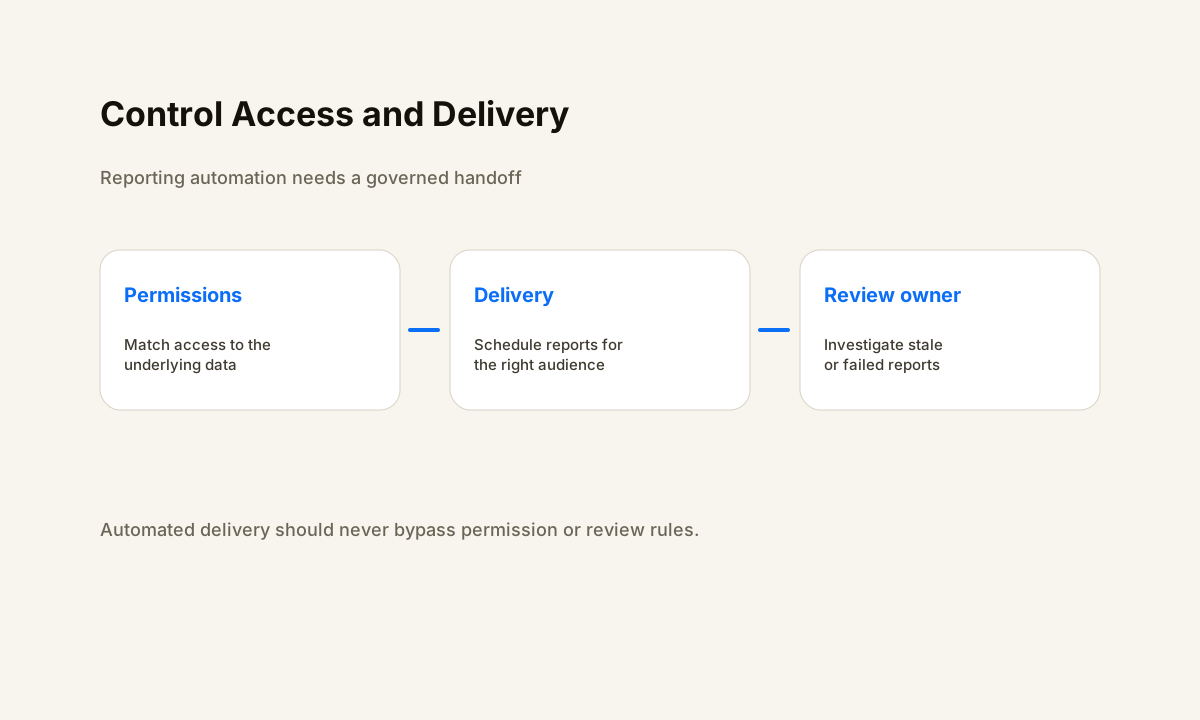
Distribution is part of the workflow. Metabase documents dashboard subscriptions that can send results through supported notification channels such as email or Slack, while its permission system controls who can create or manage notifications and what underlying data a recipient can access. That distinction matters because scheduled delivery should not become a shortcut around data permissions.
Metabase can work well for a business that has a stable operational database and someone comfortable owning models, queries, collections, and permission rules. It can be less convenient when the business depends heavily on SaaS sources that require a separate extraction or normalization layer before the data reaches the database.
The practical evaluation question is whether Metabase is close enough to the source of truth to reduce manual exports without creating an unmanaged query layer. If the team cannot explain which database tables, models, and permissions feed a dashboard, the reporting system is still fragile.
Build One Reliable Reporting Pipeline Before Adding More Dashboards
Whichever platform you choose, begin with one complete reporting workflow. Pick a decision that matters, identify the source system, define the required fields, set a freshness target, create the transformation logic, build the report, configure access, schedule delivery if needed, and define what happens when the refresh fails. That gives the team a repeatable operating pattern.
An example sales reporting flow could track fields such as lead_created_at, owner_id, first_action_at, opportunity_stage, booked_at, closed_at, revenue, last_refresh_at, and refresh_status. These are examples, not a universal schema. The point is to preserve the state changes that let the team verify what happened.
Reconciliation should be part of the workflow. If the dashboard says there were fewer opportunities than the CRM, someone should be able to trace whether the difference came from a filter, an association, a delayed refresh, a source-field change, or a failed connector. A report that cannot be reconciled becomes decoration when the numbers are challenged.
If your source data is already inconsistent, fix that before adding more dashboards. The CRM migration implementation checklist shows how field definitions, identifiers, ownership, and reconciliation affect downstream reporting. For a broader automation design, the small-business workflow automation guide explains how to define triggers, states, and exception paths first.
Use a Practical Scorecard Instead of a Feature Checklist
Run the same reporting use case through every shortlisted platform. Use a real but safely controlled source and ask the same questions each time. Can the tool connect to the source without manual exports? Who owns the credential? How is freshness configured? Where are calculations defined?
Can the team limit access appropriately? Can the report be delivered on the required cadence? What evidence appears when the refresh fails?
Score maintainability as seriously as setup speed. A small business rarely benefits from a reporting stack that only one contractor understands. Require a source map, metric definitions, credential ownership, refresh rules, permission notes, failure-handling steps, and a short change log.
Those artifacts make later troubleshooting faster because the team can distinguish a source problem from a model problem or a dashboard problem.
Also test one exception. Change a source field name in a safe test environment, revoke a test credential, or use a record that should fall outside a filter. The goal is not to break production. The goal is to see whether the reporting workflow exposes failure clearly enough that an owner can respond.
If your reporting requirement is part of a larger lead-management system, compare it with the lead management automation platform comparison. The reporting tool should support the operating system rather than become a second, conflicting source of truth.
Choose the Tool Based on Ownership, Data Location, and Change Rate
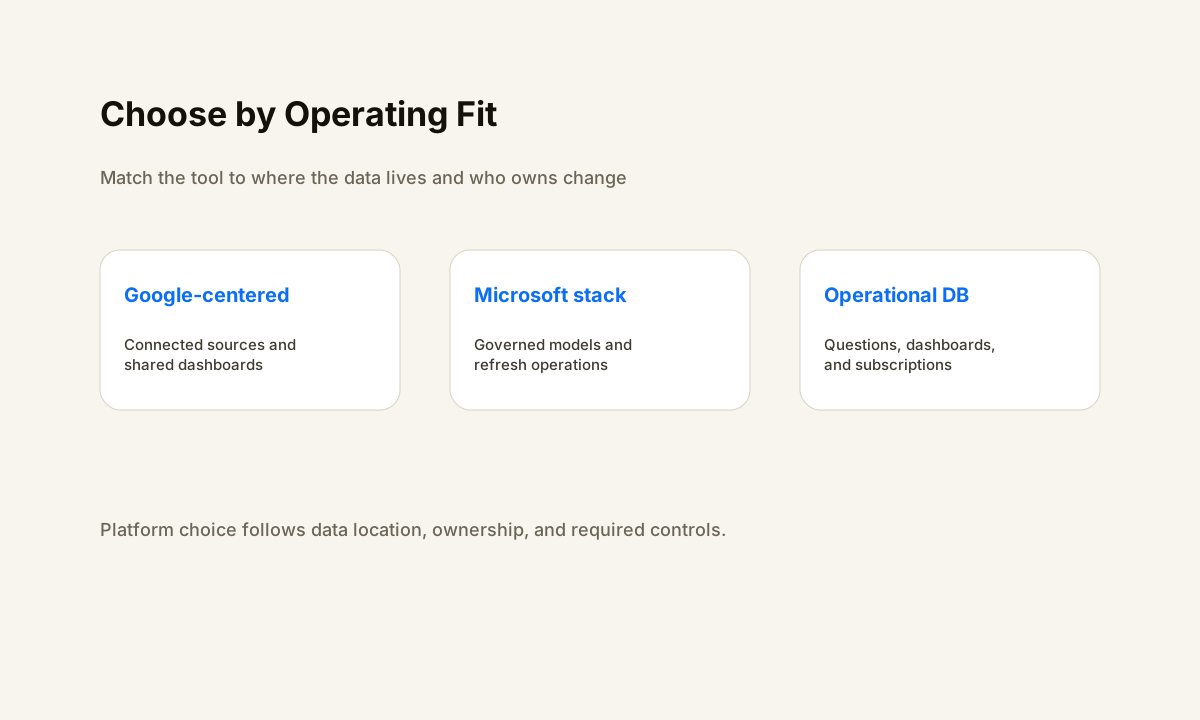
Looker Studio is a sensible shortlist candidate when the reporting workflow is Google-centered, the data can be reached through supported connectors, and the team wants straightforward shared dashboards with visible freshness controls.
Power BI is a sensible shortlist candidate when the company needs a more governed semantic model, works heavily in the Microsoft ecosystem, or expects reporting to become a shared analytics layer.
Metabase is a sensible shortlist candidate when operational data already lives in a database and the team wants dashboards, questions, permissions, and scheduled subscriptions close to that source.
None of those descriptions should replace a live test. Vendor features, plan limits, connectors, and permission behavior can change. Verify the exact source, refresh, sharing, and delivery requirements against current documentation before committing the reporting workflow to production.
The final decision should answer five operational questions: where is the source of truth, who owns metric definitions, how fresh must the data be, who can see each report, and who responds when automation fails. Once those answers are clear, platform differences become much easier to evaluate.
If the business needs help turning scattered reporting into an owned system, use the HWA automation process to see how discovery, mapping, controlled implementation, and verification fit together.
Sources
Frequently Asked Questions
What is reporting automation?
Reporting automation is a controlled process that moves trusted source data through refresh or transformation rules into dashboards, scheduled reports, alerts, and review steps. A complete design also defines permissions, failure handling, and ownership.
Which reporting automation tool is best for a small business?
The best fit depends on the existing data stack and who will maintain it. Looker Studio can fit Google-centered reporting, Power BI can fit Microsoft-centered analytics and semantic models, and Metabase can fit teams that want dashboards and subscriptions close to operational databases.
Does reporting automation require a data warehouse?
Not always. A small business can begin with direct connectors or a well-defined operational database when the sources are stable. A warehouse or reporting layer becomes more useful when multiple systems need consistent joins, transformations, history, or governance.
How often should automated reports refresh?
Refresh frequency should match the decision the report supports, the source system limits, and the cost of stale data. Define a freshness target for each metric, then verify that the connector or semantic model can reliably meet it.
What should be monitored when automated reporting fails?
Monitor source availability, credentials, connector status, refresh timestamps, transformation errors, row or record counts, scheduled delivery, and permission changes. Every failed refresh should have an owner and a clear path to verify the corrected report.
Related Resources
Turn reporting into an owned workflow
Map the source, metric definitions, refresh rules, access, delivery, and exception handling before adding another dashboard.