
HubSpot Custom Reporting vs Standard Dashboards
HubSpot custom reporting vs standard dashboards comes down to the question you need answered, the data needed to answer it, and who will maintain the view.

TL;DR
- Use standard dashboards when existing reports already answer the team's operating questions and the main need is a shared view with clear access.
- Use custom reporting when the question needs selected objects, activities, associations, fields, filters, or calculations that standard reports do not express.
- A dashboard is the presentation layer. A custom report is the analysis definition that can be placed inside that dashboard.
- Reporting quality depends on clean CRM properties, agreed metric definitions, validation against known records, and a named owner.


HubSpot Custom Reporting vs Standard Dashboards: Two Different Jobs
A HubSpot dashboard and a custom report solve different parts of the reporting problem. HubSpot describes dashboards as a way to organize reports into one view for a purpose or user.
A sales leader might use one dashboard for pipeline health while a service manager uses another for ticket and response metrics. The dashboard answers a presentation question: which reports should this audience see together?
A custom report answers an analysis question: how should HubSpot assemble and analyze the data behind this metric? HubSpot's custom report builder lets a user choose data sources, add fields, set filters, choose a visualization, and save the result.
The builder can work across multiple HubSpot data sources, including CRM objects and activities. That matters when a business question crosses the boundaries of a standard report.
The distinction prevents a common design mistake. A team may ask for a custom dashboard when the real gap is one missing report. Another team may ask for a custom report when the needed report already exists and only needs to be placed on a dashboard with the right access. Name the missing layer before adding complexity.
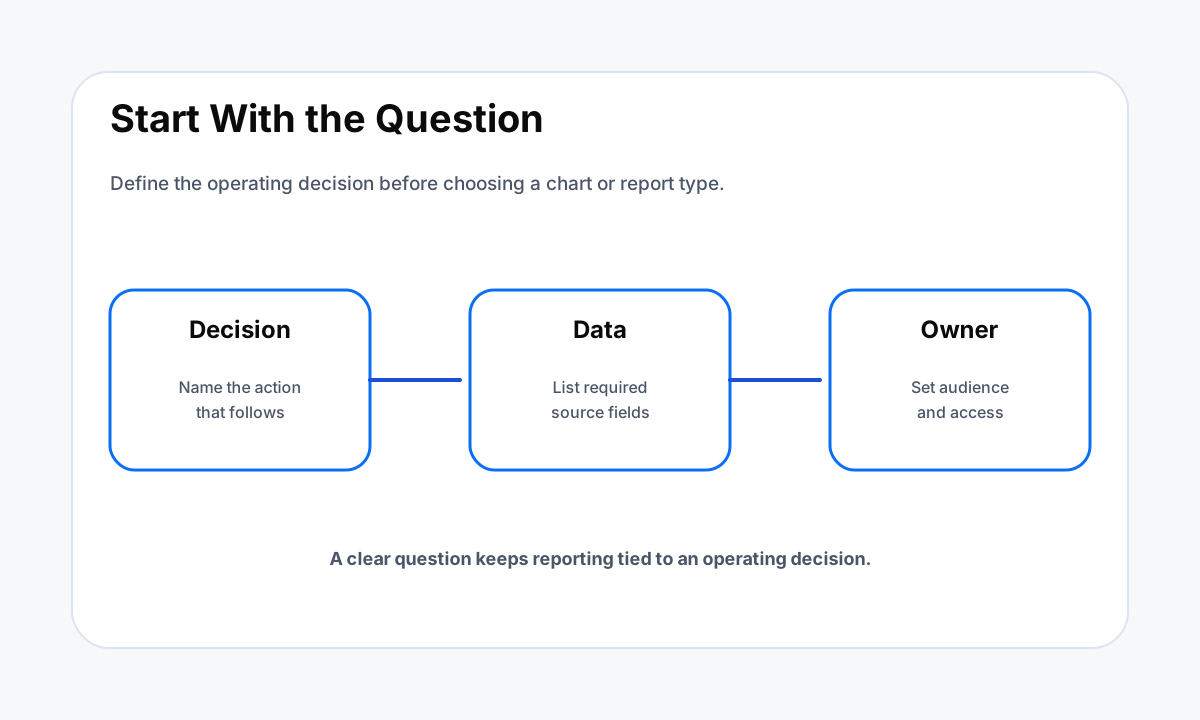
Start with one decision the report should support. Examples include deciding which deals need intervention, whether lead sources create qualified pipeline, where handoffs stall, or which accounts have both sales activity and recent marketing engagement. A precise decision makes it easier to tell whether a standard report is already enough.
When Standard Dashboards Are the Better Fit
Standard dashboards have an advantage when the team needs common views and HubSpot already models the data in a useful way. A manager can create a dashboard, add reports, and control who can view or edit it. The result is an operating surface rather than a separate analytics project.
This path also reduces maintenance. Each custom field, filter, association rule, and calculated definition creates something the business must understand later. If a standard deal report answers the question, rebuilding it as a custom report adds work without necessarily improving the decision. The same principle applies to common marketing, sales, and service views.
Dashboards support governance because access and ownership can be managed around the view the team actually uses. That matters when different teams need different reporting views or when an executive dashboard should not become an open editing surface. A report can be technically correct and still fail as an operating tool if nobody knows which view is authoritative.
Use a standard-first test. Put the existing reports on one dashboard, set the filters the audience needs, and compare the output against known records. If the dashboard answers the decision question without manual spreadsheet work or missing context, stop there. Custom reporting is useful when there is a real analysis gap, not simply because more customization is available.
When HubSpot Custom Reporting Is Worth the Extra Work
Custom reporting becomes useful when the business question requires a combination the standard report does not provide. HubSpot's custom report builder can analyze multiple data sources and includes fields drawn from the sources selected. That can support questions involving CRM records, activities, marketing engagement, and other connected HubSpot data.
HubSpot documents custom reporting for Professional and Enterprise subscriptions across several Hubs, and users who create or edit reports need the relevant permissions. Before designing a reporting project, confirm the current account has the required subscription and access. That avoids designing a solution around a capability the account cannot actually use.
Custom reports are especially useful for business-specific definitions. A company might define a sales-accepted opportunity using a named deal stage, a required source property, an assigned owner, and a data-completeness rule. If that definition drives real decisions, encoding it in one maintained report is safer than asking every manager to recreate the same filter by hand.
The tradeoff is ownership. Someone must know which source is primary, why each field is included, what the filters exclude, and how the report should behave when a property changes. Custom reporting should make a decision easier to trust. If it creates a metric that only one person can explain, the reporting problem has simply moved to a new place.
Compare Data Scope, Setup Effort, Governance, and Change Cost
Data scope is the first tradeoff. Standard reports work inside structures HubSpot already provides. Custom reports can combine selected data sources and expose a more specific analysis. Wider scope helps when the question crosses objects or activities, but it also increases the need for clear definitions and testing.
Setup effort is the second tradeoff. A dashboard built from existing reports can be assembled quickly. A custom report needs a source model, field selection, filters, visualization, and validation. If the report influences staffing, budget, pipeline review, or account prioritization, that extra design work can be justified.
If the report is only a convenience view, the same effort may not create a better operating outcome.
Governance is the third tradeoff. Dashboards give the team a shared place to consume reports and manage access. Custom reports give the team control over the metric definition. In a healthy setup, those layers work together: the report owns the logic, and the dashboard owns the audience and operating context.
Change cost is the fourth tradeoff. Field renames, pipeline changes, lifecycle definitions, new associations, and integrations can all affect reporting. Before creating a custom report, decide who will test it after CRM changes. If no one owns that work, favor the smallest design that still answers the question.
Avoid Reporting Failure Modes Before You Add More Charts
Bad source data breaks both standard and custom reporting. A polished chart cannot correct duplicate records, blank required properties, inconsistent stage use, or integrations that write values in different formats. Fix the data contract before adding report complexity. Define the source of truth for each important field and the event that should update it.
Metric drift is another common problem. Two teams can use the same words and mean different things. Terms such as qualified lead, active pipeline, and response time need definitions that can be tested against records. Write the rule next to the report owner and review it when the sales or service process changes.
Dashboard sprawl creates a separate problem. If each manager clones a dashboard and edits filters, the company can end up with several versions of the same KPI. Use ownership and access controls to designate the view used for operating reviews, and keep experiments separate from the authoritative dashboard.
Custom report sprawl can be harder to spot because the differences are hidden inside filters and data sources. Keep a short inventory of decision-critical reports with the business question, owner, source fields, filters, and last validation date. HWA's CRM automation workflow design guide uses the same principle for automation rules: source of truth and ownership should be explicit.
Build a Reporting Layer That Can Survive CRM Changes
Start with the meeting or decision, not the chart. Write the question, the person who uses the answer, the cadence, and the action the answer can trigger. Then list the required fields and where each field comes from. This prevents the report from becoming a collection of interesting data with no operating use.
Try a standard report first. If it answers the question, add it to the correct dashboard and set access. If it does not, name the missing capability before building custom logic. The gap might be a cross-object relationship, a business-specific filter, an activity measure, or a calculation. Build only that missing piece.
Validate the finished report with known records. Pick examples that should be included, examples that should be excluded, and an exception that has caused confusion before. Confirm the report and dashboard produce the expected result. Then document the owner and the changes that require a retest, such as a new pipeline, property rename, lifecycle rule, or integration.
If the reporting problem extends beyond HubSpot, separate CRM reporting from broader business intelligence. Our reporting automation guide covers cross-tool reporting, while our GoHighLevel versus HubSpot comparison looks at CRM fit. For a stack that needs mapping before changes, start with the workflow audit or review HWA automation services.
Standard Dashboards vs Custom Reporting
| Criterion | Standard dashboard approach | Custom reporting approach |
|---|---|---|
| Best fit | Common recurring questions | Business-specific analysis |
| Data model | Existing report definitions | Selected sources, fields, filters, and associations |
| Setup effort | Lower when reports already exist | Higher because logic must be designed and tested |
| Ownership | Dashboard audience and access | Metric logic, source data, and validation |
Frequently Asked Questions
Is a HubSpot dashboard the same as a custom report?
No. A dashboard organizes reports into one operating view. A custom report defines the data sources, fields, filters, and visualization used to answer a specific question.
When are standard HubSpot dashboards enough?
They are enough when existing reports already answer the team's recurring questions and the main need is to organize those reports for the right audience.
Who can use HubSpot custom reports?
HubSpot documents custom reporting for Professional and Enterprise subscriptions across several Hubs, with report permissions required for users who create or edit reports.
Can a custom HubSpot report be added to a dashboard?
Yes. Custom reports can be saved and used on dashboards, so custom analysis can still live inside the operating view used by managers and teams.
Should a small business start with custom reporting?
Start with the business question. If a standard report answers it, use that. Build custom reporting only when the standard option cannot express the needed logic.
Sources
Need reporting your team can trust?
Map the metric before you build the dashboard
If your HubSpot reporting has conflicting definitions, missing fields, or too many versions of the same KPI, HWA can map the source data, reporting rules, and ownership before a larger rebuild.